Morphological profiling by high-throughput single-cell biophysical fractometry
·Adding new dimensions on single-cell analyses
Zhang et al (2023) is a different type of single-cell paper. Rather than capturing the transcriptomic profile, the authors set up a high-throughput microscopy to profile the cell morphology. I think it is a real timely read because of the current breakthrough in low-cost microscope building (in the news of Nature)[https://www.nature.com/articles/d41586-023-01267-8] and the use of AI to improve image resolution and completeness. In that light, we will generate better and more image profiles of many cells that warrant the development of cheap and fast diagnostic tools.
Another interesting point of this paper is dissecting the cell images using fractal features. This is really a typical question one would ask after getting high-resolution images; how can we better quantify the cell traits?
Fractal analyses
Here the authors claimed that some of the cell features i.e surface ruggedness, subcellular complexity could not be described (aka. representation) by typical Euclidean geometry compared to cell size and shape.
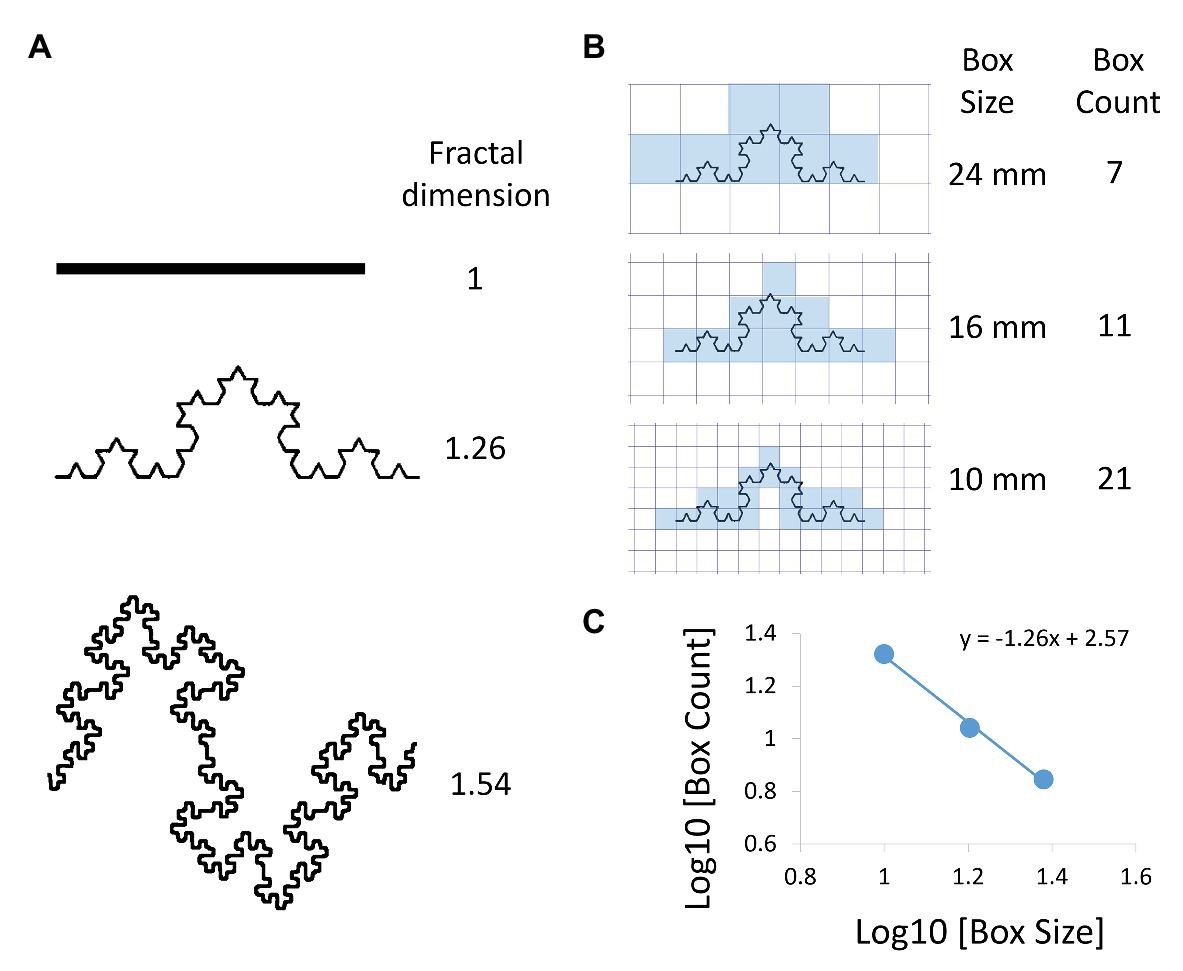
Thus they try to describe the cells in Fractal dimension FD.
Looking into a few literature papers, FD is the slope of 2 metrics that follow the inverse power law relationship. A simple example from this review Tanabe et al figure 1 showed us how to use the box-counting methods to extract the FD of a shape.

Of course the fine-grained surface texture can be captured effectively by the FD, given that we have a detailed image. The review then showcased how to use FD to characterize lung diseases especially emphysema.
In this paper, the authors extracted in total 17 FD features from the angular light scattering (ALS) profile from a high throughput imaging system ultrafast QPI operation in multi-ATOM.
One of the interesting feature is spatial correlation of the density fluctuation Cp(r) that measures light intensity between 2 points on a cell image, in other words the change of contrast over the cell as a metric of cell complexity. When a cell have many sub-cellular organelles, one would expect the correlation would be low.
Fractal features on single-cell identification
The paper show three useful applications on FD based methods in 1) distinguish cells from different cancer subtypes and 2) capture the changes of cell morphology upon drug treatment.
In case 1, FD feature overcome the limitation of conventional features, such as cell size, to achieve label-free single-cell identification of different cell lines.

In case 2, using all 17 FD features, the authors could distinguish cells from different drug treatments: one drug Docetaxel (DTX) arrests the microtubule remodeling (lead to cell death) and the other drug Gemcitabine (GCB) interferes DNA synthesis. Here, FD features (FD and ALS mean) picked up the subtle differences between these 3 groups of cells and we can see quite successful spatial separation in the UMAP in figure 3g.

In case 3, the authors use the up to 101 euclidean + FD features to characterize cell-cycle state of cells.
Conclusion
Fractal analysis is a useful method to extract local characteristics of cell morphology and will be of particular importance with the advance in image processing technologies and better microscopes.